Recession Model Update (November 2020)
Friends,
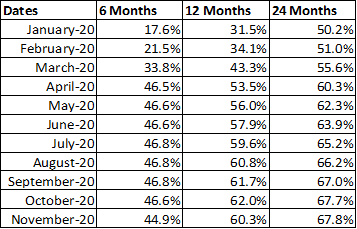
Model probabilities have finally ticked slightly downwards. As the effect of today’s vaccine news propagates through the market, it would make sense for these probabilities to continue falling in the months ahead.
Current Values (as of November 7, 2020)
Visualizing Europe’s New Lockdown
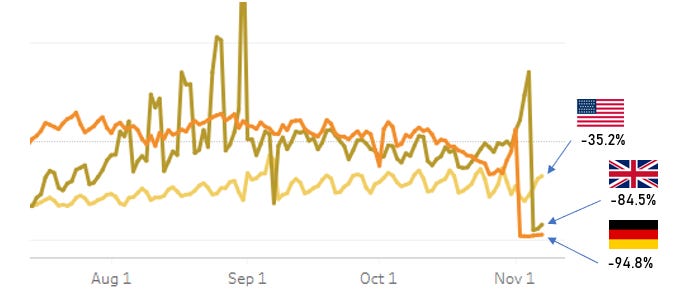
I find OpenTable’s restaurant traffic data to be a helpful measure of lockdown severity across various regions. Another benefit is that it is updated daily.
For example, you can clearly see the impact of Europe’s new lockdowns, as measured by the number of year-over-year (2020 vs. 2019) seated diners. While the U.K. and Germany trended better than the U.S. during the summer, the tables have now turned.
This customizable chart available here
The spikes in U.K. restaurant traffic during August were caused by the “Eat Out to Help Out” scheme. While the scheme ended on August 31, U.K. restaurant traffic continued to stay strong until the recent lockdown.
Until Next Time
Terrence | terrencez.com
View previous updates in the archive.
I’m always eager to hear your comments or questions. Just hit reply to this email, and I will respond. You can also fill out the contact form here. Either way, I will respond from my personal email.
All opinions are my own and not the views of my employer.


